
Step 1
Merge the requested information
Energy, fuels, waste, water, and fleet data flow from existing sources into a single structure. What is already being measured does not need to be collected again.
Use Case · Proof of Concept
A customer sends a questionnaire regarding energy, emissions, and organization. This allows you to generate a verifiable response from existing operational data — and creates a foundation that will remain in place for the next customer.
Initial situation
Electricity consumption is recorded in the meter log, fuel in the accounting department, and waste quantities with the disposal company. Whoever fills out the questionnaire gathers all of this together — and next year, for the next customer, starts all over again.
Step by step
Step 1
Energy, fuels, waste, water, and fleet data flow from existing sources into a single structure. What is already being measured does not need to be collected again.

Step 2
Before any information is sent out, it is checked against the history. Any anomalies that would require explanation in the questionnaire are noticed here and not during the follow-up inquiry.
Step 3
Where a figure is missing, it is marked as outstanding — with an indication of where it will come from in the future. This is more resilient than a value that nobody can explain later.

Step 4
Every piece of information remains linked to its source. With the next questionnaire, the questions change, but the database does not.
The values in the product views are sample data.
Prerequisites
So that it is clear which information is required in which format.
Meter data, energy bills, waste disposal certificates, fleet data.
Someone who grants approval — after all, the response ultimately goes to a customer.
Result
Every value remains traceable back to the source, even months later.
What is missing appears as an open item — with a deadline instead of an estimate.
For the second questionnaire, the research is largely eliminated.
From the field
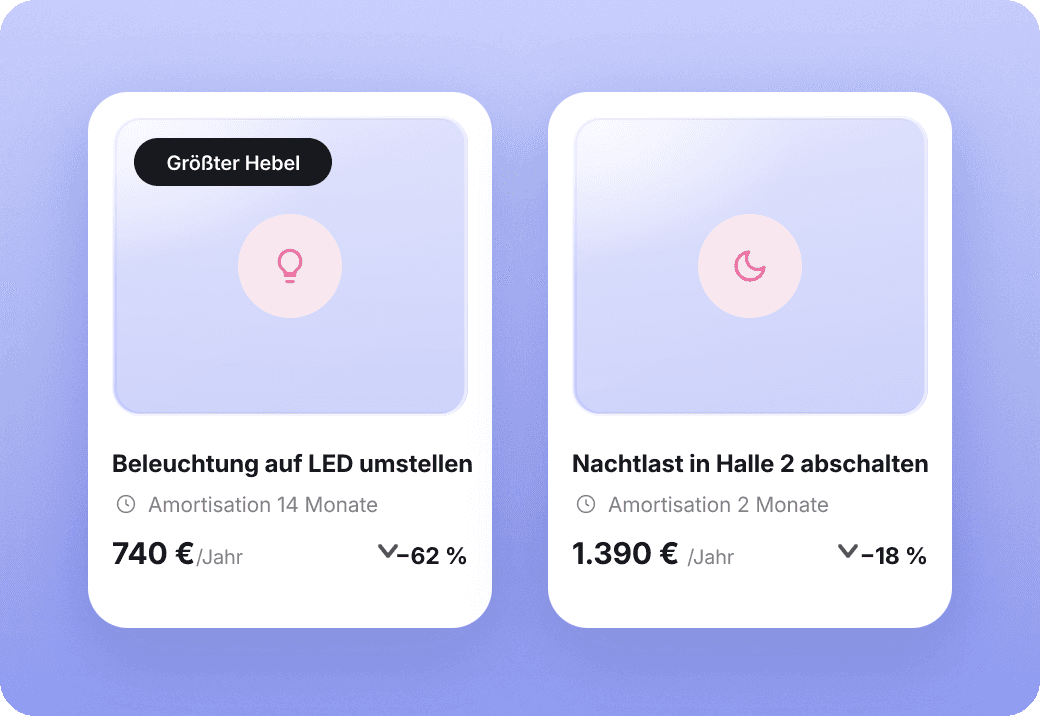
At the Decker wood manufactory, relevant consumption and operating data were made visible using smart meters and a radar sensor. From this, potential savings of over €3,500 per year were identified — and Scope 1 and Scope 2 data were made continuously available.
Potential and actual benefits depend on location, data availability, and the measures implemented.
More Use Cases
Show us your data situation. We will tell you which of these paths will yield results for you the fastest.