Use Case · Costs

Reduce operating costs

The annual financial statement shows a total. What causes it and which part of it is avoidable is not included. Here is how you get from the total to a measure that pays off.

Initial situation

The consumption is known. The cause is not.

Everyone in the building knows that energy costs have risen. Which system, which shift, or which night is responsible for this is unknown — because the bill condenses everything into a single number. Without this context, any energy-saving measure remains a guess.

Step by step

How it works

strait Automation: Live consumption from sensors with detected anomaly

Step 1

Consumption over time instead of as a total

Meters provide quarter-hour values, not monthly values. Where individual consumers are not recorded, additional sensor technology isolates them — depending on the case, without interfering with the machine control system.

strait Location Intelligence: Energy costs per location with the greatest leverage

Step 2

Recognizing the expensive patterns

Three patterns regularly cost the most: consumers starting up simultaneously, which drives up the demand charge; a baseline that does not drop at night; and individual systems that are permanently above their target. All three only become visible over time.

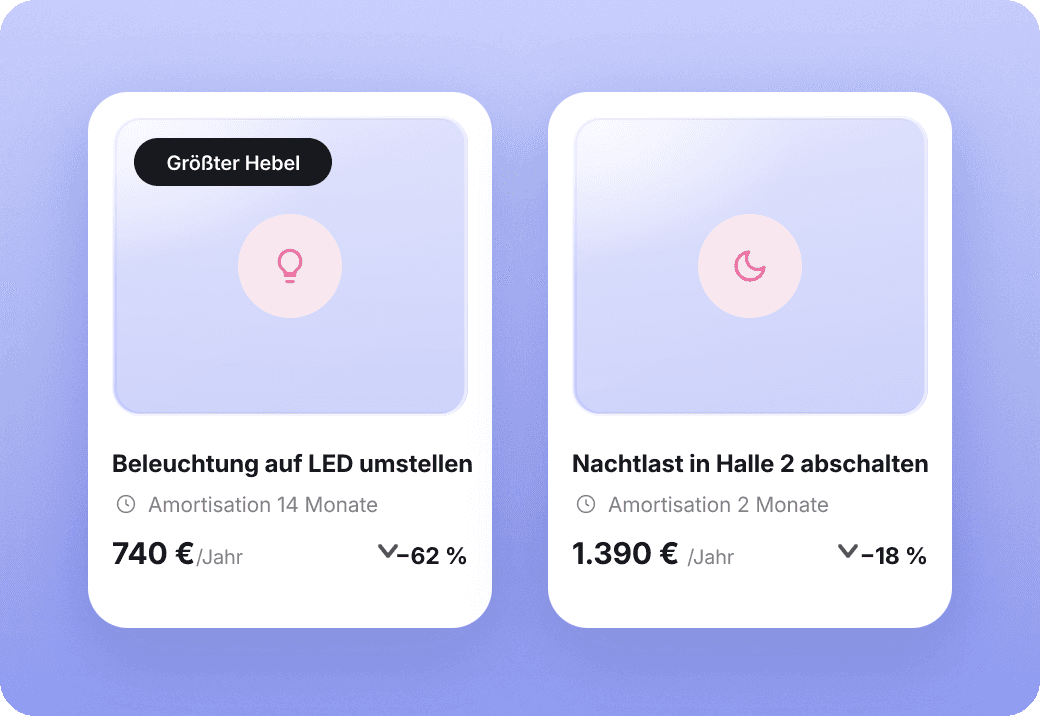
strait measures and ROI: prioritized measures with amortization

Step 3

Sort measures by Euro

For each anomaly, the expected annual savings, effort, and payback period are presented side by side. This makes it easy to decide what to tackle first — and what isn't worth the effort.

strait records: greenhouse gas balance, VS report and customer responses

Step 4

Prove the effect

After implementation, the new route lies alongside the old one. What was actually saved is thus determined and simultaneously flows into the greenhouse gas balance.

The values in the product views are sample data.

Prerequisites

What you need for this

A meter with load profile

Quarter-hourly values instead of monthly totals. For larger connections, this is often already available.

Your operating hours

Without them, it is impossible to say which consumption is to be expected and which is not.

Optional: Sensors at the consumer

When the main meter is not sufficient to narrow down the cause.

Result

What is written at the end

A named causer

Not just anywhere in the company, but a specific system with a time window.

Calculated savings

Expected Euro per year, effort, and payback period — before the decision.

A before and after

The course of events after implementation proves whether the calculation has paid off.

From the field

One radar sensor, €3,500 a year

At Holzmanufaktur Decker, relevant consumption and operating data were made visible using smart meters and a radar sensor. This helped identify potential savings of over €3,500 per year — and made Scope 1 and Scope 2 data continuously available.

Potential and actual benefits depend on the location, data situation, and implemented measures.

More Use Cases

Different situations, same way

Answer customer questionnaire

Which case applies to you?

Show us your data situation. We'll tell you which of these paths will yield results the fastest for you.

Your AI-powered workspace for operational sustainability.

Your AI-powered workspace for operational sustainability.

Stay in the loop

Stay in the loop

Get product notes, planning ideas, and workflow tips in your inbox.

Get product notes, planning ideas, and workflow tips in your inbox.

© 2026 strait earth GmbH

© 2026 strait earth GmbH

Shape tomorrow.

Shape tomorrow.