No shared overview
Energy consumption, cost centers, invoices, and operating data are considered separately.

Cost & Impact Intelligence for Manufacturing
strait connects energy, operational, and financial data. The platform identifies where costs and emissions arise, prioritizes the most sensible measures, and makes results transparent for your company and external requirements.
For manufacturing SMEs that want to work more economically and sustainably using existing data.
01 · Vision

02 · Act
03 · Book

Starting situation
During operations, data regarding energy, costs, facilities, locations, and measures is generated every day. However, it is often kept separately in invoices, Excel files, meters, and individual departments. As a result, it remains unclear where the greatest leverage lies – and what can already be proven.
Energy consumption, cost centers, invoices, and operating data are considered separately.
High consumption is visible. Why it occurs and what it costs often remains unclear.
For customer inquiries, EcoVadis, or VS (formerly VSME), the same data has to be manually gathered all over again.
A workplace for operational sustainability
strait combines four work steps into a single platform. This turns a single measurement, invoice, or inquiry into a traceable process of improvement.
Step 1 · Capture
strait bundles existing data sources such as energy meters, invoices, cost centers, locations, and operational data. Where data is missing, non-invasive sensor technology can be added in a targeted manner.
Sensor technology
Invoices & Cost Centers
Excel & Files
APIs
Operational data
Step 2 · Understand
strait puts consumption and costs into the right context: by location, period, consumer, or operational process. Anomalies, peak loads, and missing data become visible – including the question of what pays off first from an economic perspective.

Anomalies
Location comparison
Cost and emission drivers
data gaps
Step 3 · Improve
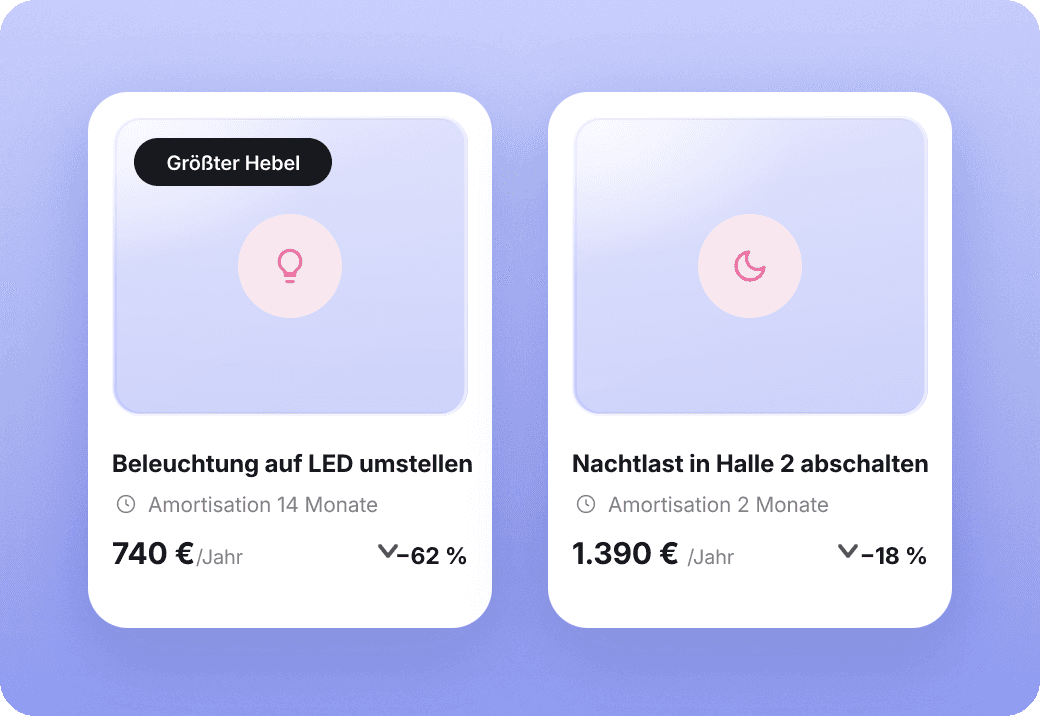
Insights turn into concrete tasks. Measures are prioritized by expected savings, effort, and impact, assigned to responsible owners, and tracked in their progress.
Potential savings
Effort
Responsibility
Progress
Before/After
Step 4 · Verify
What has been recorded and improved within the company can be reused as verifiable proof – for example, for carbon footprints, EcoVadis, VS (formerly VSME), or specific customer inquiries.
Carbon footprint
EcoVadis
C las sified report
Customer inquiries
Audit Trail
Data context
An energy value only becomes helpful once it is clear which location, consumer, cost center, or operating state it is assigned to. strait connects data not just technically, but in the context of your operations.
Data sources
Energy & Sensors
Invoices & Cost Centers
Locations & Operational Data
strait
A shared, traceable database with rules, tasks, and history.
Results
Understanding cost and emission drivers
Prioritize measures with ROI
Answer requests for proof faster
Product Modules
Each module supports a clear work step. Together, they ensure that insights do not just end up in the dashboard.
The central place for data points, tasks, responsibilities, and progress.

Understand consumption, anomalies, and key figures by location, period, or consumer.
Prioritize and track improvements based on savings potential, effort, and impact.
Generate traceable answers and evidence for external requirements from the existing database.
Complemented by automations and an AI-powered workspace that assists with analysis, tasks, and information preparation.
How it works
From the first meter to the final certificate, the process is always the same — only the entry point changes.
01
Meters, smart meters, accounting, ERP, and existing files flow into a common database. Where measuring points are missing, non-invasive sensors provide targeted additions — without interfering with machine controls or interrupting operations, depending on the application.
02
The strait AI detects anomalies, peak loads, hotspots, and missing data, and attributes them to the location, period, and consumer.
03
Measures are evaluated based on Euro savings, payback period, and CO₂ impact before investments are made.
04
The same data provides the greenhouse gas balance, EcoVadis answers, VS report (formerly VSME), and individual customer questionnaires without having to maintain figures twice.
Core skills
What the platform delivers in everyday use — regardless of which use case you start with.
01
Sensors, meters, bills, and existing files converge across locations into a single database.
02
Every consumption is translated into kWh, Euros, and CO₂ — broken down by location, area, and system.
03
Savings potentials such as switchable night loads or compressed air leaks are evaluated according to investment, savings, and payback period.
04
Measures are assigned responsible parties, deadlines, and a transparent before-and-after comparison.
05
Greenhouse gas balancing according to Scope 1, 2, and 3, VS Report (formerly VSME), EcoVadis responses, and customer questionnaires without duplicate data entry.
Use Cases
strait doesn't have to solve everything at once. Getting started begins with a specific problem and expands from there to other locations, data sources, and requirements.
Visualize peak loads, unnecessary base loads, abnormal consumption patterns, and recurring costs.
Structure the relevant database for CO₂ footprinting, EcoVadis, VS (formerly VSME), and customer inquiries.
Transparently manage consumption, key metrics, and improvements across multiple locations.
Comparison
Most tools cover a part of the journey. The break occurs where insight is supposed to transition into action, and action into proof.
| Data collection | Cost and ROI logic | Action management | Reusable credentials | Usability for Medium-Sized Businesses | |
|---|---|---|---|---|---|
| Consulting and Excel | |||||
| Carbon and ESG reporting tools | |||||
| Energy Monitoring Dashboards | |||||
| strait |
The classification describes typical categories, not individual providers.
Results
strait turns scattered data into a continuous cycle of improvement – ensuring that economic and sustainable decisions are not separated from one another.
Identify cost and energy levers faster
Empowering teams to act with clear measures and responsibilities
Document improvements in a visible and traceable manner
Reuse the same database for customers, ratings, and reports
From the field
At Holzmanufaktur Decker, relevant consumption and operating data were made visible using smart meters and a radar sensor. From this, potential savings of over €3,500 per year were identified. At the same time, Scope 1 and Scope 2 data were made continuously available.
Potential and actual benefits depend on location, data availability, and the measures implemented.
Frequently Asked Questions
Get started
Discuss your data situation and the use case with the greatest leverage with us. Together, we will identify a sensible starting point.