Use Case · Proof of Concept

Manage ESG data and create the VS report

The VS report (formerly VSME) is voluntary, but is increasingly expected — by customers, banks, and in tenders. In this way, it is generated from data that is already available, rather than from a special effort in the fourth quarter.

Starting position

Once a year, reconstructing what went on for twelve months.

In November, someone starts gathering meter readings, invoices, and disposal records. In the best-case scenario, what comes out of this is complete — but it is rarely comprehensible, and the following year, the exact same search begins all over again.

Step by step

How it works

strait Automation: Live consumption from sensors with detected anomaly

Step 1

Continuously maintain the report-relevant variables

Energy, fuels, waste, water, and fleet data flow from existing sources into a structured system — continuously, not just once a year. What is already being measured does not need to be collected again.

strait Location Intelligence: Energy costs per location with the greatest leverage

Step 2

Checking what the numbers show

Before a key figure goes into the report, it is compared against the trend. Outliers and gaps stand out during this process — and are named instead of smoothed out.

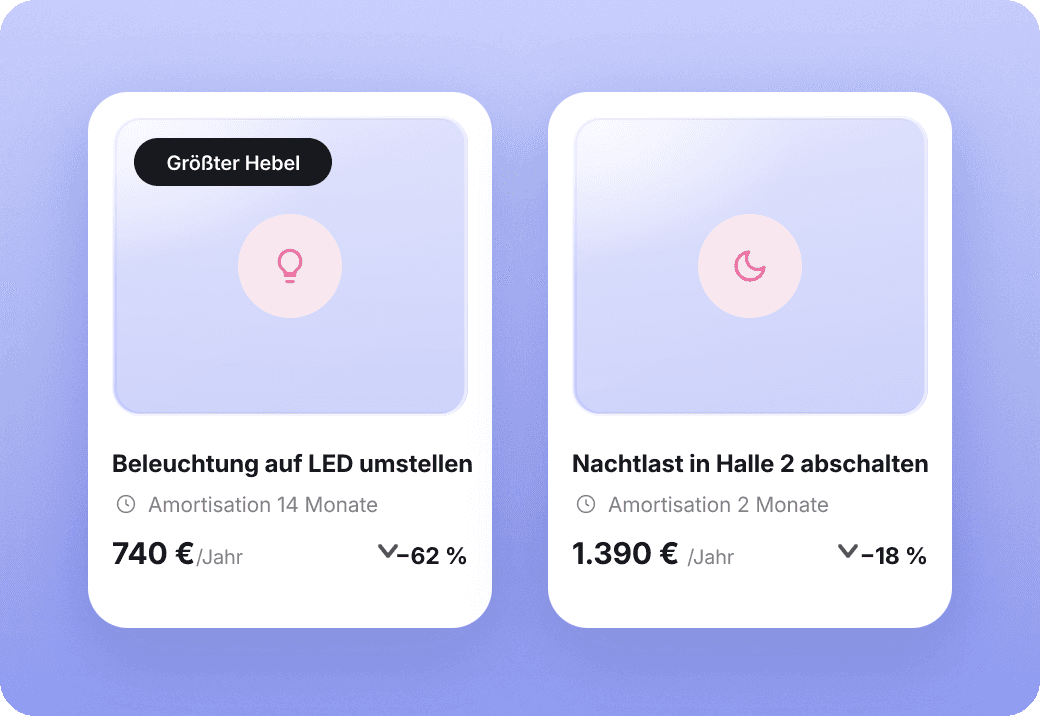
strait measures and ROI: prioritized measures with amortization

Step 3

Key figures become measures

A report that only documents changes nothing. The same data shows where consumption and costs coincide, turning them into prioritized actions with ownership and progress.

strait Proofs: Greenhouse Gas Balance, VS Report, and Customer Responses

Step 4

The report is generated from the inventory

The greenhouse gas balance according to Scope 1, 2 and 3 as well as the VS report (formerly VSME) are generated from the same basis. Every value remains traceable back to its source — even months later.

The values in the product views are sample data.

Prerequisites

What you need for this

Access to existing sources

Meter data, energy bills, disposal certificates, fleet data.

A reporting framework

VS (formerly VSME) or a customer format — this determines which information is required.

A jurisdiction

Someone who releases the values. The report goes to clients, banks, or into tenders.

Result

What is left at the end

Continuously updated key performance indicators

No longer a November project, but a status that can be retrieved at any time.

A comprehensible report

Every value with its source and timestamp — even for inquiries a year later.

Actions instead of just documentation

The same data shows where consumption and costs can be reduced together.

From the field

One radar sensor, €3,500 a year

At Holzmanufaktur Decker, relevant consumption and operating data were made visible using smart meters and a radar sensor. This identified potential savings of over €3,500 per year — and made Scope 1 and Scope 2 data continuously available.

Potential and actual benefits depend on location, data availability, and the measures implemented.

More use cases

Different situations, same way

Reduce operating costs

Fill out customer questionnaire

Which case applies to you?

Show us your data situation. We will tell you which of these paths will yield results the fastest for you.

Your AI-powered workspace for operational sustainability.

Your AI-powered workspace for operational sustainability.

Stay in the loop

Stay in the loop

Get product notes, planning ideas, and workflow tips in your inbox.

Get product notes, planning ideas, and workflow tips in your inbox.

© 2026 strait earth GmbH

© 2026 strait earth GmbH

Shape tomorrow.

Shape tomorrow.