


In use by leading medium-sized businesses

Customer logo
Customer logo
Customer logo
Customer logo
Customer logo

For manufacturing companies

Energy management software that shows where money is being lost.

Load profiles, base loads, and individual consumers become visible — and with them, the savings that pay off first.

Over €3,500/year in savings potential already identified

Hosted in the EU · GDPR-compliant · Your data does not train AI models

Book a 15-minute potential check

Show us your meter landscape and operating hours — in a 15-minute call, we will look directly at what can be evaluated with them.

For manufacturing businesses with relevant electricity costs — no PV or home storage control for private households.

Starting situation

The counter shows the sum. Not where it comes from.

An annual financial statement doesn't tell you which consumer, which shift, or which night cost the money. Without this context, any saving remains just a guess.

Peak loads drive up the demand rate

Several appliances start up at the same time. The peak determines the price for the entire year.

Base load also runs at night

Equipment, compressed air, and refrigeration continue to run outside of operating hours without generating any benefit.

Numbers without consequence

Measured consumption helps little if no one knows which measure pays off first.

"We started with electricity, water, air quality, and temperature, and saw consumption patterns we'd never had on our radar before. Then we added the level sensor in the silo. In the past, an employee had to climb up regularly, and all the machines stood still while they did. Today we can see the level live in the dashboard. That alone saves us over €3,500 a year. At the same time, all our ESG data comes together automatically. We're now well prepared for new ESG requirements."

Eirik Decker, CEO I Holzmanufaktur Decker

How it works

Get started in 3 steps

Step 1

Intro call

In a short call, we take a look at your business and clarify where the biggest lever is and whether strait is the right fit for you.

Step 2

Setup

We install the sensors, set up your site, and train your team, so everything runs with no effort on your part.

Step 3

Get started

You use strait day to day: compare sites, implement measures, and pull records at the push of a button.

Range of functions

Energy monitoring that goes all the way to implementation

strait Automation: Live consumption from sensors with detected anomaly

Record consumption continuously, not monthly

✓

Meters, smart meters and sub-distribution boards during ongoing operation

✓

Non-invasive sensors without intervention in machine control systems

✓

Individual consumers, halls, and locations can be analyzed separately

strait Location Intelligence: Energy costs per location with the greatest leverage

Read the load profile, instead of guessing

✓

Peak loads visible over the course of the day and week

✓

Out-of-hours consumption is reported

✓

Locations and plants directly comparable
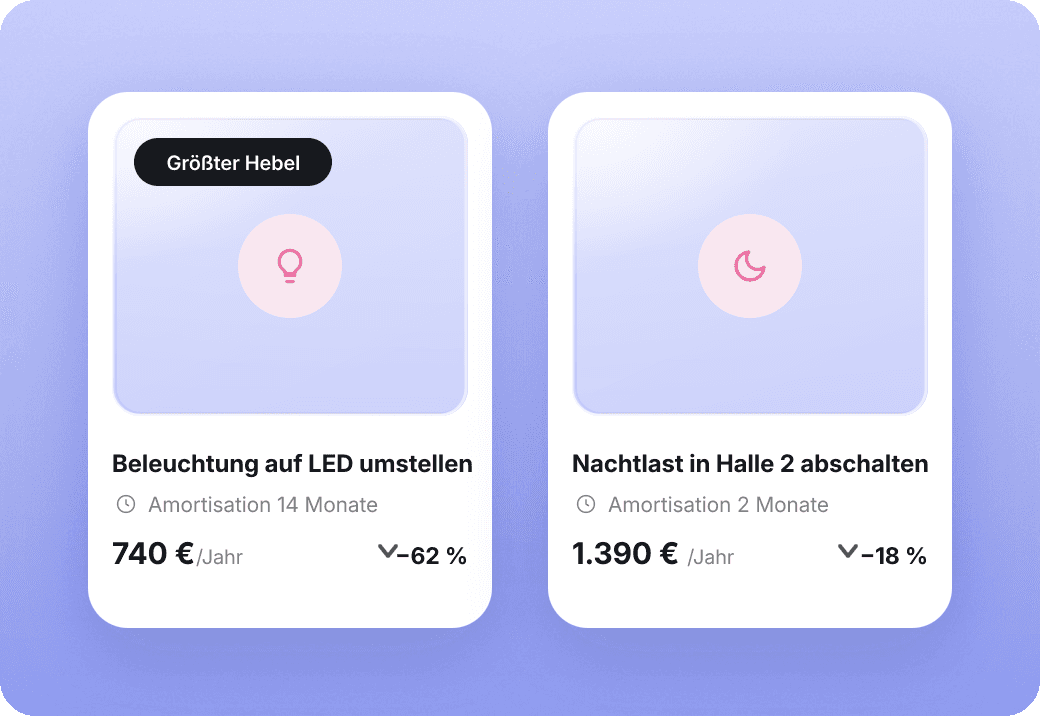
Strait measures and ROI: prioritized measures with payback

Arrange levers by Euros

✓

Evaluation based on expected savings and payback period

✓

Effort and responsibility recorded for each measure

✓

Effect verifiable after implementation

strait proofs: greenhouse gas balance, VS report and customer responses

The savings also serve as proof

✓

Lower consumption reduces both costs and emissions

✓

The same data supports the greenhouse gas balance

✓

Receipts for customers and banks are generated with no extra effort

Cover

Where the levers typically lie

Peak loads

Simultaneously starting consumers determine the demand charge for the entire year.

Base load outside of operating hours

Compressed air, refrigeration, and systems that continue to run at night and on weekends.

Individual consumers

Test benches, compressors, wallboxes — where the annual bill only shows a lump sum.

Frequently Asked Questions

What businesses want to know in advance

What exactly does energy management software do?

It aggregates consumption data from meters, sensor technology, and existing systems, assigning them to time, location, and plant. An annual total thus becomes a trend curve, revealing when and how costs are incurred.

What is a load profile analysis and what are its benefits?

The load profile shows electricity consumption in quarter-hourly values instead of as a monthly total. This reveals peaks that determine the demand charge, as well as consumption outside of operating hours. Both are items that cannot be identified without this profile.

What data do we need to start with energy monitoring?

In most cases, the meters that are already in place are sufficient. Where individual consumers are not recorded, non-invasive sensor technology provides targeted supplementation — depending on the application, without interfering with machine control systems or causing business interruptions.

How quickly can electricity costs be reduced with this?

That depends on how many measuring points are available and how quickly measures are implemented. Anomalies such as night loads often become apparent within the first few weeks, as soon as the progression is visible instead of just the total. Whether this results in savings depends on the implementation.

How much does energy management software cost?

The price depends on the number of locations, measuring points, and the required sensor technology. We will discuss it during our call once it is clear what you actually need — and not beforehand as a flat rate.

Where is your first lever for savings?

Show us your meter landscape and your operating hours. We will tell you what can already be evaluated with them.